Home > XML IDE - XML Editor > Screenshots > Optimize XQuery Expressions
Optimize XQuery Expressions (XQuery Profiling)
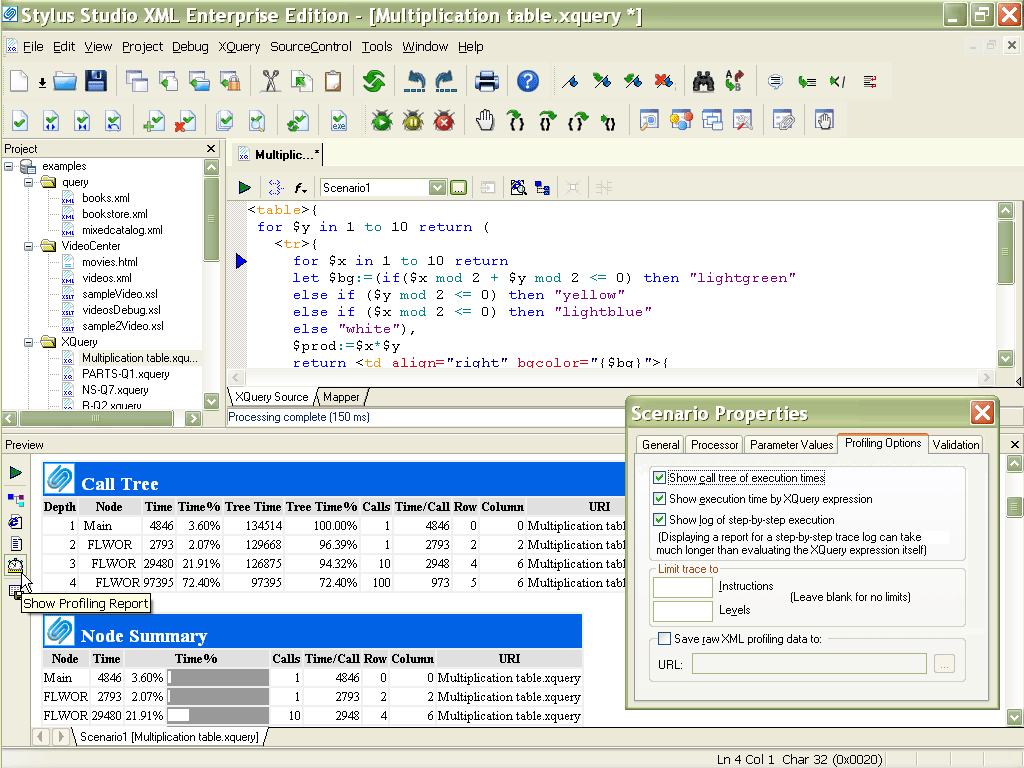
Stylus Studio® includes an advanced XQuery Profiler, shown below, to help you benchmark XQuery expressions, to identify performance bottlenecks, and to visually troubleshoot and eliminate them. Illustrated below is an XQuery expression being analyzed by Stylus Studio® - a detailed execution tree with various performance metrics including depth, node, execution time, percent of execution time, and so on, is displayed in the Preview window at the bottom of the Stylus Studio® desktop. Stylus Studio®'s invaluable Back mapping feature allows you to click on a line in the Profiler Report to highlight the line of XQuery code responsible for a particular entry in the call or node summary — you can then make a quick edit, re-execute the XQuery expression, and compare results. These features and more are demonstrated in Using the XQuery and XSLT profiler, a free online video demonstration.

Wondering what's all the XQuery fuss about? Developers should check out Learn XQuery in Ten Minutes, IT Managers should check out the Top 10 XQuery Development Trends for information about the importance of XQuery optimization and how XQuery technologies are bound to affect the way your organization builds enterprise software.

 Cart
Cart

