|
Home > XML IDE - XML Editor > XML Editor Key Features > XSLT Tools > XSLT Debugger
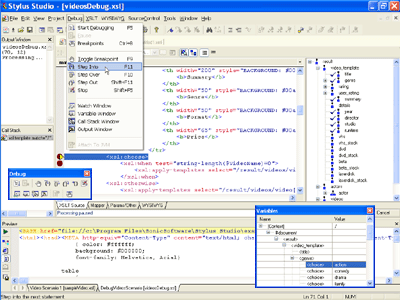
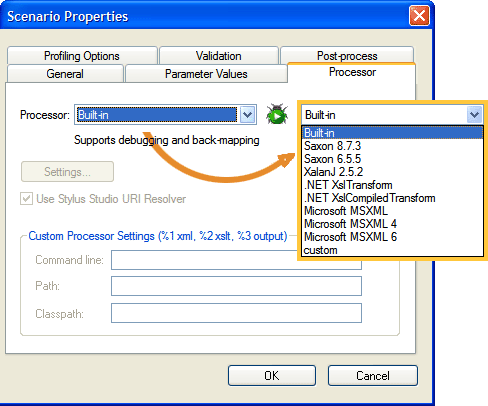
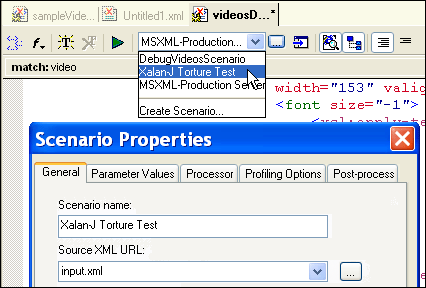
XSLT DebuggerStylus Studio features the world's most powerful XSLT debugger — a requirement for building bug-free XSLT stylesheets and XML data transformation applications. Stylus Studio's XSLT debugger gives you complete visibility and control over the XSLT transformation process, and it's the only XSLT tool to support cross-XSLT-processor, cross-language XSLT debugging. Debug XSLT using Popular XSLT ProcessorsOur XSLT Debugger is unique in its comprehensive support for XSLT debugging using all of the most common underlying XSLT processor, including MSXML, System.XML (Microsoft.NET XSLT Processor), Saxon, and many others, in addition to supporting our own built-in, internal XSLT processor. Our Open XSLT Debugging Architecture in Stylus Studio's XSLT Debugger enables you to reproduce and isolate exactly those stylesheet bugs you are encountering, with confidence. This is more helpful than other XML tools, which provide XSLT debuggers that exclusively support only their own proprietary XSLT processors. Stylus Studio lets you go with what you know — it's standards-based, after all. Choosing an XSLT processor (illustrated below) is simply a matter choosing from a list of pre-configured options, or specifying the command line arguments needed to kick off an XSLT processor:
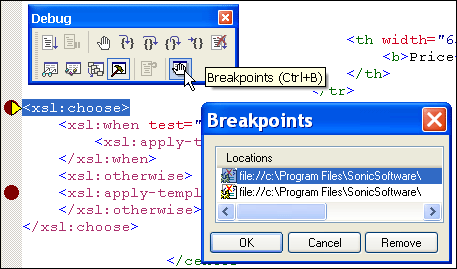
Finally! an XSLT debugger that can be used by all XSLT developers, regardless of their platform and programming language preferences — We think that's the way it should be! Set/Toggle XSLT BreakpointsStylus Studio allows you to easily set and toggle breakpoints anywhere in your XSLT stylesheet code (illustrated below). The red octagons in the left margin represent breakpoints. The yellow triangle shows the XSLT processor's current state. You can set/toggle breakpoints from a toolbar or by typing the "F9" key.
Single Step-Through XSLT StylesheetsThe XSLT Debugger lets you step through the execution of an XSLT stylesheet, line-by-line, just as you would using a conventional software debugger. Using the XSLT Debugger toolbar, you can:
Single-Stepping through an XSLT Stylesheet is illustrated here:
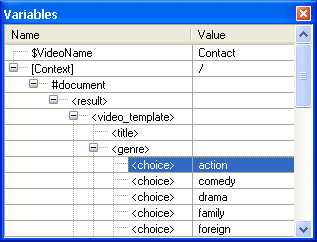
Inspect XSLT Variables & XSLT ParametersStylus Studio's XSLT debugger has an XSLT Variables window that shows all of the XSLT variables and values that are in scope, relative to the XSLT processor's current context. The contents of the XSLT Variables window changes dynamically as you step through the XSLT transformation process.
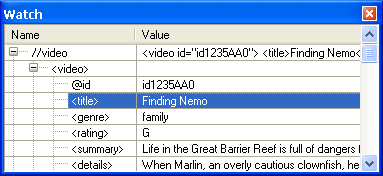
Set Watches on XSLT Variables or XPath ExpressionsSimilarly, in addition to viewing all of the XSLT variables in scope, you can set watches on custom XSLT variables or any XPath expression. Because variables and XPath expressions are typically themselves tree fragments, you can easily expand/collapse them in the Watch window. The XSLT Watch window is helpful, for example, if a template rule isn't firing and you suspect an incorrect XPath in the template-match expression.
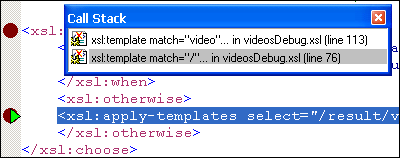
XSLT Template Stack WindowThe XSLT Template Stack window helps you keep track of where you are in the XSLT stylesheet; it's analogous to the Call-Stack in a conventional software debugger. The Template Stack window is particularly useful for stylesheets that employ so-called "push-processing" (that is, where XSLT templates are defined, but not explicitly called; rather they are matched and fired by the XSLT processor's default processing rules), which often results in a relatively deep XSLT template-stack.
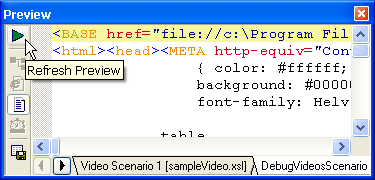
Support for Debugging Java XSLT Extension FunctionsStylus Studio is the only XSLT Debugger to support integrated debugging of any Java XSLT extension functions. This means that as you step through an XSLT stylesheet, Stylus Studio seamlessly steps through an extension function code in our Java IDE, passing any XSLT variables necessary to the Java Process, then, returns from the Java process, having passed back any return values to the XSLT processor. All of the debugging windows, such as the Variables window, Template Stack window, Watch window, all work in the Java IDE displaying the Java stack, Java variables, and Java watches. We think this is more useful than other XSLT debuggers that simply crash upon encountering an XSLT extension function. XSLT Output WindowStylus Studio's XSLT debugger provides a XSLT Output window that displays the output of the XSLT processor in real time, as you walk through the XSLT transformation process. One of the helpful features included in the XSLT Output window is Backmapping — if you click on a line of output, Stylus Studio highlights the XSLT stylesheet source that generated that line of output. Backmapping is an invaluable tool for troubleshooting incorrect XSLT stylesheet output, and for answering the age-old question: "How did that get there?". Other features include the ability to refresh the output, save the output to a file, compare different XSLT outputs (via a tabbed pane interface), and much more.
Configure and Save XSLT Debugging ScenariosStylus Studio allows you to create XSLT Scenarios — associations of XML documents, XSLT stylesheets, target outputs, and XSLT processors (and their respective configurations). Stylus Studio allows you to create such scenarios, save them, then easily switch between different debugging scenarios as you develop. Want to debug an XSLT stylesheet on MSXML? Scenarios make it easy.
Simply put, Stylus Studio's XSLT Debugger is the most powerful XSLT debugger available in the industry — Download a free trial today!
|
PURCHASE STYLUS STUDIO ONLINE TODAY!!Purchasing Stylus Studio from our online shop is Easy, Secure and Value Priced! Try Stylus XSLT DebuggerDownload a free trial of our award-winning XSLT Debugger today! Learn XQuery in 10 Minutes!Say goodbye to 10-minute abs, and say Hello to "Learn XQuery in Ten Minutes!", the world's fastest and easiest XQuery primer, now available for free! Why Pay More for XML Tools?With Stylus Studio® X16 XML Enterprise Suite, you get the most comprehensive XML tool suite at one incredibly low price. Value: it's just one of many reasons why smart XML developers are choosing Stylus Studio! |
XML PRODUCTIVITY THROUGH INNOVATION ™

 Cart
Cart


