Home > XML IDE - XML Editor > Screenshots > XQuery Debugging
XQuery Debugging
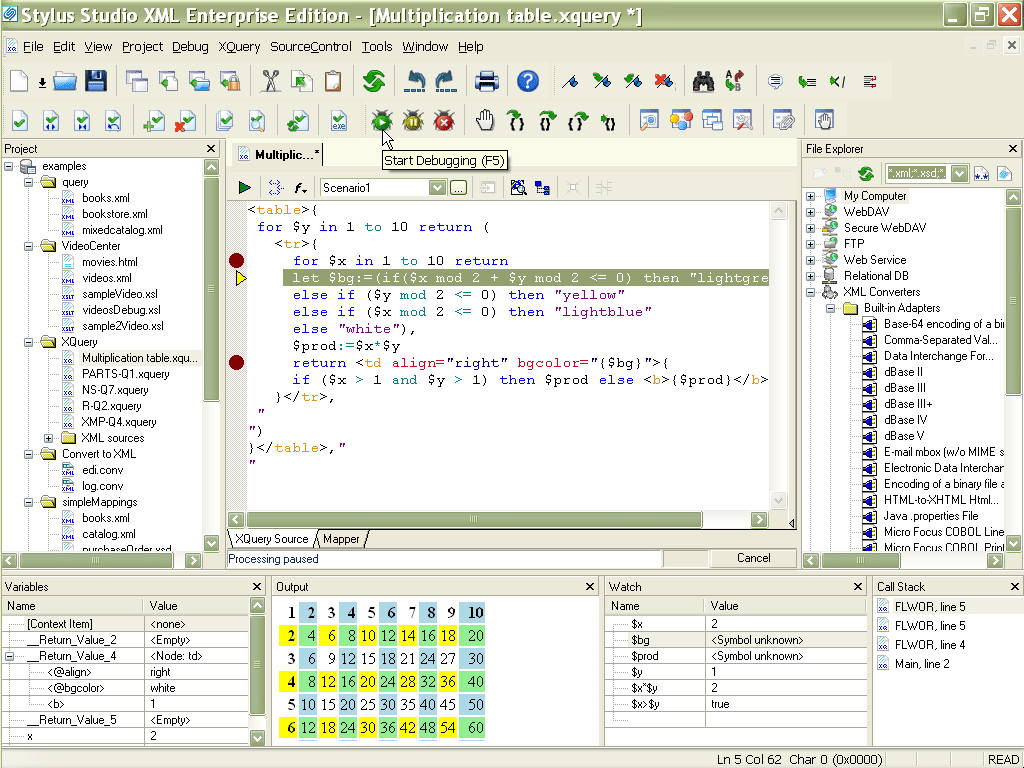
Stylus Studio® features the first and only XML Tool to include full support for XQuery debugging. XQuery debugging is a powerful feature for building and troubleshooting advanced XQuery expressions, allowing you to set breakpoints and single step through the evaluation of an XQuery expression. Features like a call-stack, XQuery Watch Window, XQuery Output Window, and an XQuery Variable Window give you complete visibility into every aspect of the XQuery evaluation process, thus eliminating any un-wanted bugs. Try out XQuery debugging with Stylus Studio® for free today!

Wondering what's all the fuss about XQuery Debugging? Check out the Top 10 XQuery Trends article to learn more about the critical importance of XQuery debugging tools in building the next-generation of enterprise software applications!
Related XQuery IDE features
More Stylus Studio Screenshots
- XML Development Environment
- Java Code Generator
- XML Diff Tool
- XML Grid Editor
- Converting to XML
- XML Mapper
- XSL Editor
- HTML-to-XML Importer
- XSL:FO Editor
- XSL Debugger
- XSLT WYSIWYG Designer
- XSLT Profiler (Optimize XSLT Stylesheets)
- XML Schema Designer
- XML Schema Mapper
- XML Schema Validator
- XML Schema Documentation Generator
- OASIS Catalog Support
- Database-to-XML Data Source Editor
- Document Type Definition Editor
- XQuery Mapper
- XQuery IDE
- XQuery Debugging
- XQuery Profiler (Optimize XQuery Expressions)
- Web Service Call Composer (SOAP Tester)
- Java IDE

 Cart
Cart

